Measuring results is a fundamental step for all companies who want to grow and evolve in the marketplace. This is a necessity that has been spreading to all areas of the company; first in sales, then in staff productivity... and now in the personnel and talent department. Setting KPIs in human resources is key to getting the most out of a company’s human capital and meeting strategic objectives of HR department.
What is a KPI in human resources?
KPI means Key Performance Indicator and are performance indicators. In other words, it’s a unit of measurement that’s used to establish the results of specific actions. They therefore serve as a reference to evaluate processes and detect successes and shortcomings.
Human resources indicators measure processes related to recruitment, training, talent management, etc. These indicators enable us to set objectives and to know, at all times, if we are carrying out the right actions to reach them.
How to set a KPI in human resources
The key indicators in human resources will stay with you for a long time as they serve to gauge the department’s evolution, prepare forecasts, etc. For this reason it’s essential to define them right from the start. The four aspects that should be taken into account are explained in this Visual Strategist video:
- Measures: what exactly are we going to measure? This could be the average cost incurred in securing each new recruit or the percentage that represents how many times an employee takes sick leave.
- Objective: KPIs help us to meet objectives, so we therefore must establish one. We could, for example, try to reduce sick leave by 2%.
- Source: it’s important to know, from the outset, where we’ll obtain information to complete our KPIs. This could be a CRM or a human resources software.
- Frequency: you also need to define how often you’re going to review each KPI and establish a frequency.
An example: average time employees stay in the company
- Measure: average number of years an employee stays in the company.
- Objective: 4 years
- Source: HR Software
- Frequency: Quarterly
Characteristics of good KPI
There is a very simple rule to help you establish effective KPIs, and the fact is, they should be SMART. In other words:
- Specific: a KPI should refer to a specific task or action. For example: reduce the rate of employee absenteeism by 2%.
- Measurable: if it can’t be measured, then we cannot interpret the data nor use specific tools to do so.
- Achievable: the KPI objectives you set must be achievable under the conditions you have.
- Relevant: it’s also important to ensure that the metrics you choose are relevant to your business and that they add valuable information.
- Timely: finally, each KPI must be limited to a time period and subject to regular reviews.
Most common KPIs in Human Resources
KPIs are fundamental tools for a HR department, whether for developing a strategic plan or performing a human resources audit. Each company must define their own based on their specific needs. Nevertheless, there are a series of key human resources metrics that every professional in this field should consider.
We talk about the most common human resources metrics below, as well as how they can help you improve your department’s performance.
1. Employee satisfaction levels
Does the company have a positive work climate? Are our actions working? The best way to answer these questions is by using a work climate survey and review the results obtained to detect problems and make improvements. Workplace atmosphere is crucial in reducing staff turnover, improve their sense of well-being and create employer branding that will attract new talent.
It's extremely easy to calculate, by asking employees to grade the work climate from 1 to 10, for example, and obtain an average figure from all of the answers.
2. Employee turnover
Employee turnover reveals the companies ability to retain talent. In other words, it reveals the average time an employee stays in the company, which indicates its employment stability. A high rate of staff turnover also costs the company money in terms of loss of talent and recruitment processes. This could be a sign that salaries are under the market rate or that there is a bad work environment.
How is this calculated? This is calculated by comparing the number of workers that joined the company during a specific period, with those that stayed in the same period. Or rather: the number of employees who leave the company during a year divided by the average number of employees in the company in that year. Then multiply that figure by 100 to get your annual turnover rate. ([L/Avg] x 100)
In this article by Monster UK, the average employee turnover rate in the UK is approximately 15% per year, although this figure changes considerably from sector to sector. There are many reasons why employees leave their jobs: to obtain a higher salary, dissatisfaction with their current job or simply a change in an employee’s domestic circumstances which are out of the employer’s control.
3. Rate of employee absenteeism
An estimated 141.1 million working days were lost because of sickness or injury in the UK in 2018, according to a report published by the Office for National Statistics. This was the equivalent to 4.4 days per worker. The four most common reasons for sickness absence in 2018 were minor illnesses (coughs and colds, musculoskeletal problems, among others.
This KPI can help HR teams to predict absences in the organisation or spot problems with how the company operates. In addition, by calculating the average value of each hour worked we can measure the impact of absenteeism on company finances.
Enabling employees to access a digital absence management system gives them visibility of their absence history and can reduce absenteeism. Providing visibility of their colleagues’ justified absences also increases team spirit and camaraderie when moving forward with team projects.
At Kenjo, the all-in-one solution for human resources departments, we’ve developed some free resources to help you manage day-to-day employee absences:
4. Average recruitment time
Do you know how long it takes to recruit a candidate from the moment you publish the job advert? Having access to metrics like this is fundamental if you want to make improvements and save company time and resources. Average recruitment time is the number of days that lapse from the moment the job is advertised until the new recruit starts at the company. The lower this figure is, the better.
To obtain this data, for each selection process, you have to calculate how many days elapse from the moment the job is advertised up to the day the new recruit starts, then calculate the company average. Naturally, some vacancies will be more difficult to fill than others, so it’s better to have as wide a sample as possible.
Human resources departments will ideally use an ATS (Applicant Tracking System) to effectively track recruitment time. These solutions manage internal and external communication processes extremely well, and enable you to see recruitment times. If you’re interested in implementing an ATS, take a look at the Kenjo candidate manager.
5. Recruitment costs
Recruitment costs is another human resources KPI indicator to consider. In other words, how much is invested to obtain the necessary resources for incorporating a new employee? There are several things to take into account when calculating this:
- Recruitment costs: advertising, subscription to employment portals, cost of the recruiter’s time, ATS and other software.
- Training costs: education, materials.
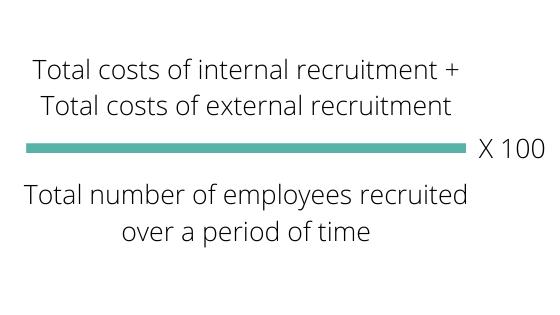
The formula is: (Total costs of internal recruitment + total costs of external recruitment) / (total number of employees recruited over a period of time).
6. Recruitment conversion rate
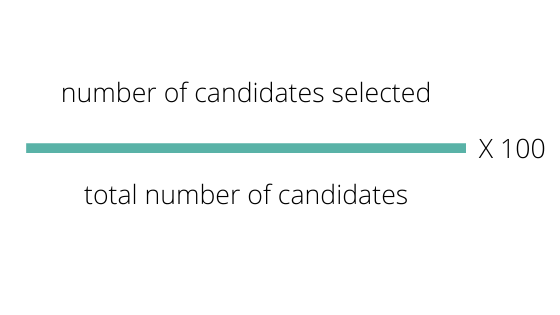
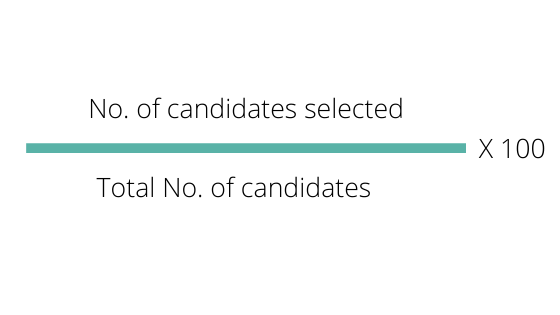
The recruitment conversion rate helps us to determine the most appropriate methods or channels to generate the most suitable candidate for the job in question. This data enables us to compare and optimise any recruitment process in order to reduce related costs. How is this calculated? It’s quite simple: (No. of candidates selected / total No. of candidates) x 100. For example: you select 20 candidates but only five go through to the next phase. The recruitment conversion rate would be: (5/20)100 = 25%
7. Workplace accidents
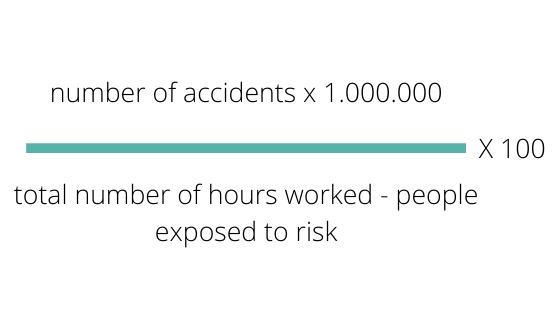
Workplace accidents are another important HR indicator, as it enables you to gauge whether your occupational health and safety measures are being correctly implemented and are effective. This information is particularly sensitive in certain industries and should therefore be included in the department’s scorecard. This information corresponds to the total number of accidents with injury per million hours worked minus the number of workers exposed to risks. The formula is: (No. of accidents x 1,000,000) / (total number of hours worked - people exposed to risks).
Other interesting KPIs to analyze
Measuring and analysing results has become a crucial part of the personnel department’s work, as it has an increasingly strategic role within the company.We leave you with other KPIs that are interesting to analyze within the department.
Recruitment
Talent attraction, especially in large companies where there are usually ongoing recruitment processes, is a time-consuming task which requires significant investment by the company. Carrying out measurement and analysis is the only way to optimise these processes.
1- Recruitment costs
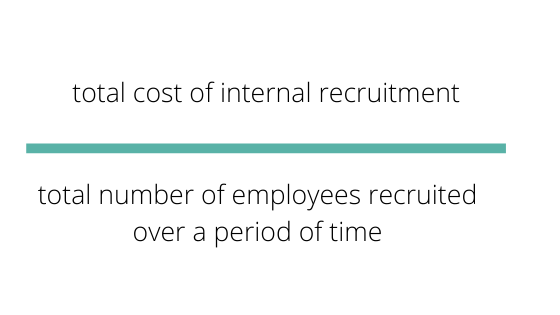
This indicator measures the amount of resources a company invests for every new recruit.
This includes total recruitment costs (advertising, subscriptions to employee portals, cost of the time invested by the team...) through to the training and preparation of new recruits.
Recruitment costs = (Total costs of internal recruitment + total costs of external recruitment) / (total number of employees recruited over a period of time).
2- Recruitment conversion rate
This conversion rate will enable you to determine the efficiency of your selection processes, and which are the most appropriate methods. This KPI measures the proportion of candidates that advance to the next stage of the process or are actually recruited. With this information you can optimise your processes and reduce, for example, costs associated with recruitment.
Conversion rate = (No. of candidates selected / Total No. of candidates) x 100.
3- Average recruitment time
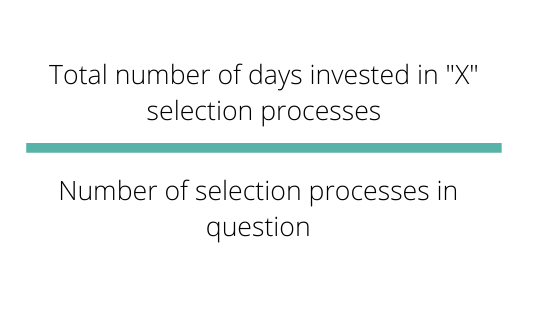
This KPI measures the time it takes to recruit a candidate from the moment you publish the job advert. The objective is to determine the level of efficiency of your recruitment process. While it’s important to keep this figure low, it should not be used as the main criteria as it’s also important to recruit the right person for the job.
Average recruitment time = total number of days invested in X selection processes / number of selection processes in question.
Talent management
There’s little point in attracting the industry’s best talent if we aren’t able to offer them a working environment in which they feel comfortable, motivated and productive. Talent management is also an important aspect that should be considered in any company strategy.
4- Abandonment rate
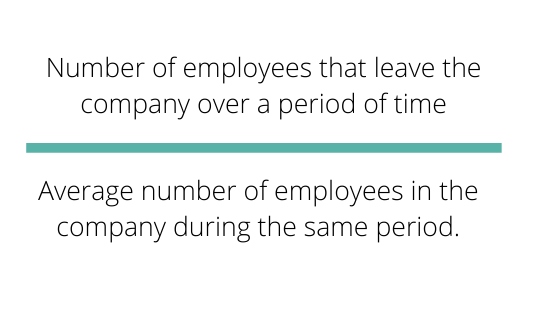
The abandonment rate measures the average number of employees that leave the company within a certain period of time, whether they do so voluntarily or not. This figure shows the company’s success when it comes to attracting and retaining talent. A high rate, in addition, represents costs for the company in terms of loss of knowledge and the investment in selection processes.
Abandonment rate = number of employees that leave the company over a period of time / average number of employees in the company during the same period.
5- Employee turnover rate
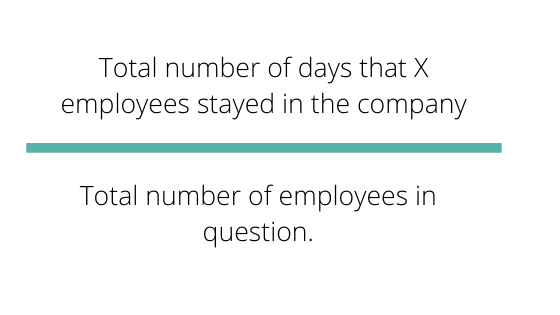
Another of the most interesting indicators for human resources is the employee turnover rate. The objective is to discover the average number of weeks, months or years that an employee stays in the organisation. The longer the period, the higher the return on the money you invest in hiring them.
Average time employees stays in the company = total number of days that X employees stayed in the company / total number of employees in question.
6- Rate of employee absenteeism
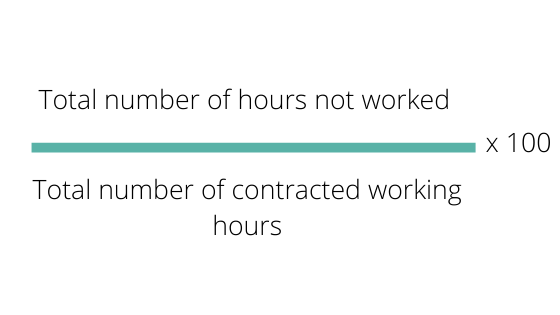
The rate of employee absenteeism should also be included in the HR dashboard as it’s a metric that calculates the percentage of an employee’s contracted working hours that are not fulfilled. It includes all types of absences, whether authorised or not. This information is very useful in predicting absences and detecting operational problems.
Rate of employee absenteeism = (total number of hours not worked / total number of contracted working hours) x 100

7 - Salary competitiveness ratio
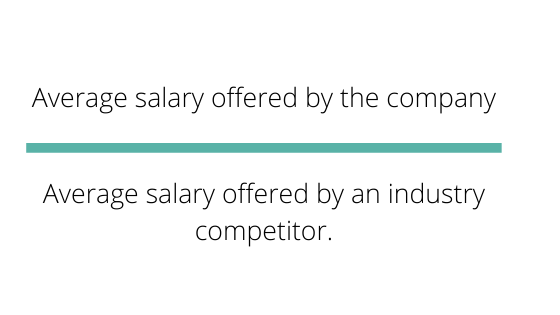
Offering a fair salary that’s in line with the job market will help the company to retain talent, but how do we know if we are within this range? The salary competitiveness ratio is the metric that can answer this question. It can be calculated in relation to the competition, or by sector.
Salary competitiveness ratio = average salary offered by the company / average salary offered by an industry competitor.
8- Benefits satisfaction
This KPI shows us whether employees are satisfied with the benefits the company offers. This is usually measured through employee engagement surveys where they are asked to rate their satisfaction with overall incentives, or rate them one by one. The answer is derived by calculating the average score from all of the answers received.
9- Internal promotion rate
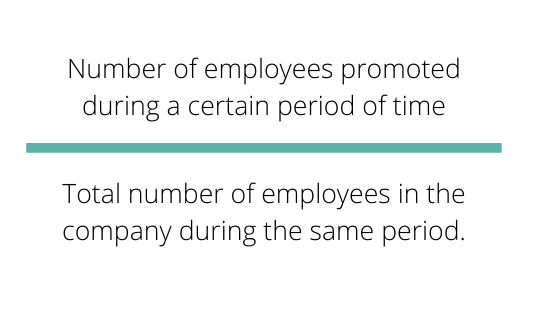
Professionals are often concerned about their growth potential in a company and this is a decisive factor when accepting an offer from the competition. Encouraging internal promotion and investing in it is key for retaining talent.
Internal promotion rate = number of employees promoted during a certain period of time / total number of employees in the company during the same period.
10- 90-day failure rate
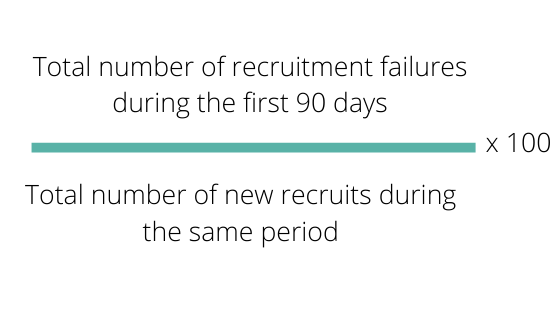
This KPI measures the percentage of new recruits that stay in the company for less than 90 days. It’s useful to help you understand the efficiency of your recruitment processes and the benefits the organisation offers.
New recruits that leave within 90 days = (total number of recruitment failures during the first 90 days / total number of new recruits during the same period) x 100.
11- Voluntary turnover rate
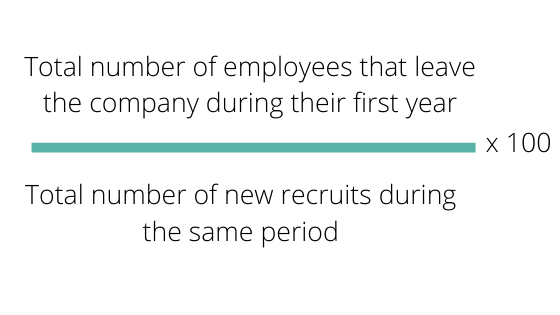
Another interesting HR indicator is the percentage of employees that voluntarily leave the company during their first year of employment. This tell us something about the success of onboarding processes, as well as the work climate.
Employees that leave the company during their first year = (total number of employees that leave the company during their first year/ total number of new recruits during the same period) x 100.
Training
Training is another way of boosting team productivity and performance.
This involves offering the appropriate tools and knowledge to carry out a task. Encouraging this kind of activity also makes employees feel a stronger connection to the company and increases their commitment and motivation.
12- Training participation rate
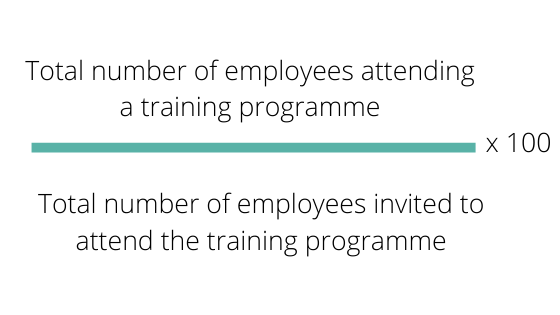
Is the team really interested in the training the company offers? The training participation rate is the most useful way to discover this. It will tell you how many employees are attending the sessions and take action to encourage their participation.
Training participation rate = (total number of employees attending a training programme / total number of employees invited to attend the training programme) x 100.
Productivity
Measuring employee efficiency or performance is another important task in the human resources department. It’s becoming increasingly common to work towards objectives, so it’s vital to monitor and control these objectives. These KPIs will reveal your team’s level of performance, detect workload peaks and enable you to better manage your company’s human capital.
13- Employee productivity rate
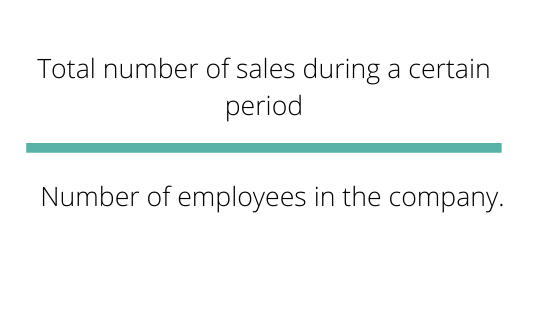
Besides personalised monitoring of each worker, the overall labour effectiveness is also an area of great interest for HR. This is usually obtained by dividing the number of sales by the number of employees in the company. Nevertheless, if you wish to perform a more in-depth analysis, other factors can be considered, such as performance, hours worked, etc.
Productivity = total number of sales during a certain period / number of employees in the company.
14- Overtime hours worked
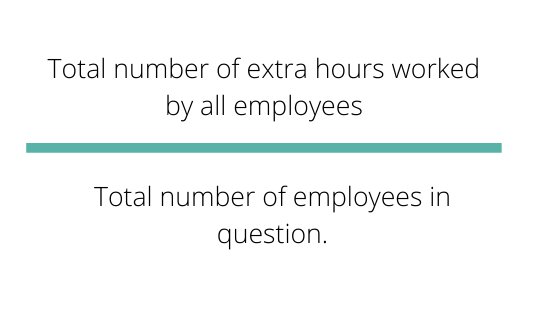
Overtime is an extremely interesting indicator as it can reveal important information when organised in a specific context. A sudden increase can result from a temporary spike in demand, higher employee commitment or inefficient management of processes. This, in turn, could directly affect another KPI we’ve looked at: absenteeism rate.
Overtime hours worked = total number of extra hours worked by all employees / total number of employees in question.
Culture and employer branding
The culture and image a company transmits externally is a key factor in attracting new talent. HR strategies often include actions focussed on improving this area. What are the KPIs that help you measure these results?
15- Employee satisfaction index
If the team is satisfied, then the company culture and actions are positive. This also means that employees will also be ambassadors, therefore improving the company’s external image. The best way to discover this is through surveys, where employees rate their satisfaction in the company. The next step is to calculate the average from the total obtained.
Strategy for implementing HR KPIs
As we mentioned previously, the KPIs should be strictly related to human resources using strategic objectives set by the company. They are all connected and the personnel department can, and must, contribute to accomplishing global targets. This study carried out by experts proposes to link a company’s global objectives to the actions implemented by HR For example:
|
Objectives
|
HR Actions |
| Improves customer orientation |
Selection of appropriate profiles
|
| Improve the work climate | Create team building activities Open bi-directional communication channels Create evaluation and feedback systems |
Once these actions have been established, then is the time to find the KPIs that will help you discover if you’re on the right track and set evaluation criteria. For example:
- 0% - the objective has not been achieved.
- 50% - the objective has been partly achieved.
- 100% - the objective has been successfully achieved.
Human resources KPI dashboards
The last step of all is to give some shape your KPIs and create a Human resources KPI template. It includes all the key metrics and presents them visually so that your analysis becomes much simpler. There are two examples below:
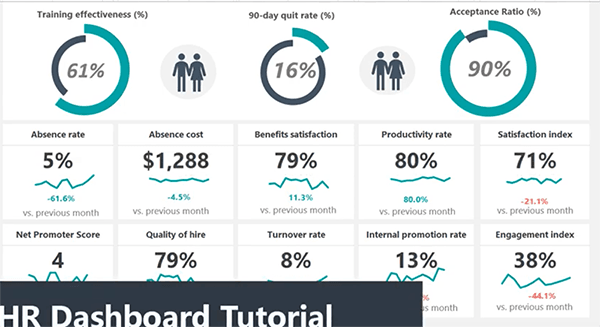
This first dashboard is extremely visual and enables you to see, at a glance, the current figures and how they have evolved over time. The upper section highlights the KPIs: the effectiveness of training, the 90-day failure rate and the job offer acceptance rate. Below are metrics related to productivity, satisfaction, recruitment, etc, giving a global vision of the different areas within HR.
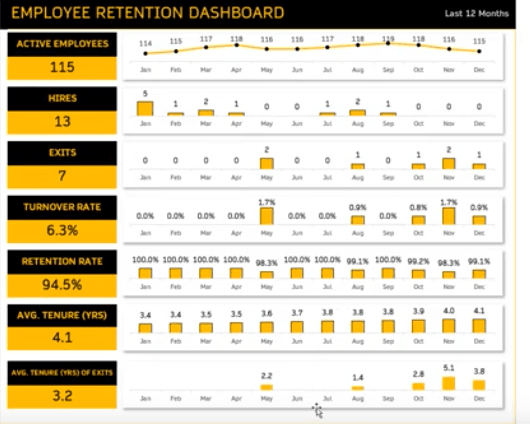
This second human resources dashboard focuses on talent retention and so all of the KPIs included are related: new recruits, leavers, retention rate, etc. The information is also represented to show how these figures evolve over a period of one year, in a clear and simple way.
You can create your own dashboard in Excel or use a HR software that automatically offers you real-time KPI reports that are the most relevant to your department. A simple and easy way to keep track of the most important data without spending time on filtering, organising and analysing them.