Measuring your results is inherent any company process, including those in personnel management. It enables you to extract valuable information about the measures you’ve implemented, draw conclusions and introduce improvements that could have a huge impact on your overall business. This is why many human resources departments use Excel templates for their KPIs.
What is a KPI in human resources?
KPIs (Key Performance Indicators) are indicators used to determine the results of activities or measure carried out within the department. They therefore serve as a reference to evaluate processes and detect improvements.
A KPI dashboard enables a human resources department to gauge, for example, if recruitment processes are successful, if training programmes implemented are useful, and if the company’s work climate is a positive one.
These indicators also enable us to set objectives and gauge if we are implementing the right actions to meet them. They should be aligned to overall company strategy. Nevertheless, within HR itself, there are a series of key human resources metrics that all departments should take into consideration: abandonment rate, turnover rate, average tenure, etc.
These are usually all displayed in the dashboard . This is a document that visually displays information at-a-glance and in a clear and user-friendly way.
At Kenjo, we’ve prepared an Excel template with human resources KPIs so that you can start working with this analysis model, quickly and easily. It will enable you to detect points for improvement to provide more value to for the company as a whole.

Why is this dashboard important?
Having a HR dashboard is vital nowadays as it enables you to manage your employee information in one single document, and obtain valuable information for both the department and the company.
Ours in one of the most powerful templates on the market as it helps you to store all the department’s KPIs in one Excel document. Once you have entered the information, it will automatically generate charts which help you analyse, crosscheck and compare data.
The Kenjo human resources KPI template will enable you to:
- Create advanced charts and analyse the department’s most important KPIs.
- Spot trends in employee recruitment and leaver rates.
- Handle all the HR department’s results in one single document.
- Measure the results in relation to the department’s objectives.
- Analyse the performance of the different departments.
- Obtain valuable information to make better decisions in the HR strategy.
For example: you can detect whether a particular department has an above average turnover rate by using this dashboard. This could indicate a negative atmosphere within the team, poor workload management or that the professionals concerned are being paid less than market rates.
Which human resources metrics are you going to use in this Excel template?
We’ve gathered the most important KPIs for the department within this human resources KPI template. These address important areas such as recruitment and talent retention.
The human resources KPIs included in the free template are:
- Total number of new recruits: the total number of new hires over a period of time.
- Total of active employees: the number of professionals that work for the company at this time.
- Total of leavers: the total number of employees who have voluntarily or involuntarily left the company.
- Average age of employees: the average age of active employees in the company.
- Average tenure: the average time an employee stays in the company.
- Abandonment rate: the percentage of employees that leave the company within a certain period of time.
- Percentage of employees by gender: chart showing the proportions of men and women in the company.
- Recruitment source: chart showing the proportion of employees derived from the different sources used by the company for selection processes.
- Employee location: bar chart showing how the company’s employees are distributed among different offices or locations.
- Employees per department: chart showing how the company’s employees are distributed among different departments that make up the company.
How to use the HR KPI template?
To get started with our Kenjo Excel template, all you have to do is enter your employee data. Once this is done, the charts will be automatically generated and you can start obtaining valuable information for your company.
This video provides a step-by-step look at each of the template’s features:
We also give a you step-by-step explanation on how to get the most out of it:
Step 1: Enable macros in the document and read the instructions
When you access the template you’ll see an invitation to “Enable macros.” Click on this button and, first and foremost, read the instructions in the first tab carefully.
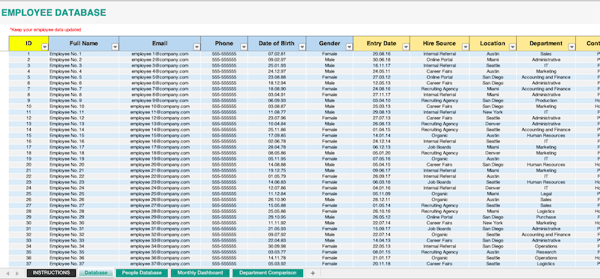
Step 2: Input your employee data
In the next window, create a database for your employees by entering the information required for each of the columns: name, email, telephone, start date, department, etc.
It’s important to keep this template up to date by indicating employee start and end dates. This will ensure that you will get be able to obtain valuable information for your company.
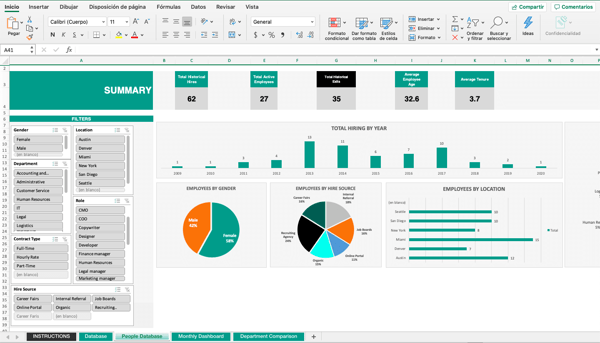
Step 3: Analyse your new KPI template
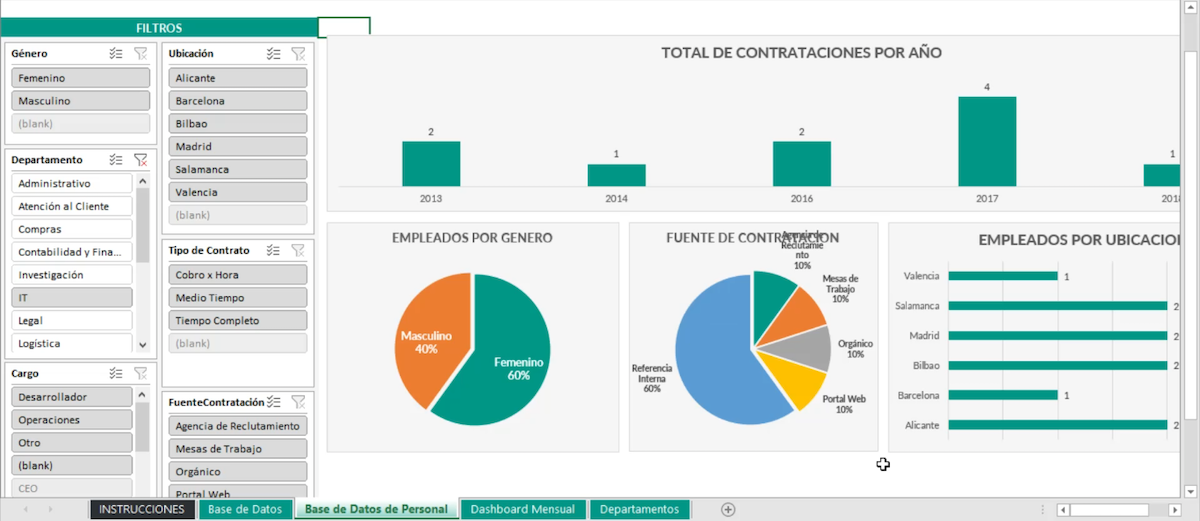
The third window displays your dashboard with general information about contracts, active employees, leavers, average age of employees, etc. You can filter information and analyse specific data by using the box on the left.
The fourth window contains a dashboard analysing new recruits and leavers throughout the year. A bar chart will enable you to see the evolution of five main KPIs and compare the data with the previous year.
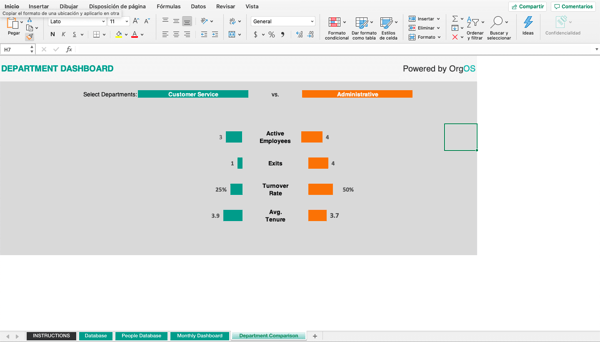
Step 4: Compare KPIs between departments
Finally, you can compare the data of two departments in the fifth window. Just click on the drop-down menu, choose the two areas you wish to analyse and check how many employees are active in each, how many employees have left and the average tenure rate.
Download the HR KPIs strategy. FREE
Our Excel template is one of the most robust on the market, and hundreds of human resources manager are already using it within their organisations. It has been designed to offer you valuable information to aid your decision-making processes and therefore create a positive impact within your organisation. Download it by clicking on the following link.
Kenjo, the all-in-one HR software
If you’d like to access your department’s KPIs in real time and store information in the cloud, use our HR software. It will enable you to create reports and analyses in just one click, customise them to suit your needs and get the most out of your data.
But there’s more: Kenjo is an all-in-one software, meaning it also includes features such as payroll, annual leave and absence tracking, talent management (ATS), etc. You’ll therefore be able to automate a large part of your department’s workload and save up to 40% of the time spent on administrative tasks.
If you’re ready to address the digitisation of HR, now is the time and Kenjo is your ally. Why not take a 14-day free trial and see all the benefits for yourself.