%20(1)%20(1)%20(1)%20(1)%20(1).jpg)
When it comes to developing and implementing a People Analytics strategy, it’s essential to know which metrics are key to obtaining the best results based on your objectives.
To make this task easier for HR managers, we at Kenjo have developed a new function to digitise and automate this process. Below we will explain which HR Analytics KPIs you should prioritise and how you can process this information.
What methods are there for processing People Analytics information?
The process of obtaining People Analytics data, then processing and translating it into relevant information can be done with two different tools: Excel spreadsheets or custom software.
Each one allows you to do certain things, such as:
- Excel spreadsheet:
-
- Manual input of employee information
- Data sorting
- Use of search filters
- Creating formulas, graphs and reports of the results
-
- People Analytics Software:
-
- Import employee information from Excel spreadsheets
- Automatic data sorting
- The ability to filter searches based on different parameters
- Use of external sources to get the most out of your dashboard
- Automatically generate graphs and personalise calculations
- Access to report templates or create your own
- Export the information to PDF
- Cloud data storage so nothing gets lost or misplaced
-
With this in mind, using software that automates the metrics we’ll see below, is one of the most practical solutions to get adequate and reliable results. With just a few clicks you can access the most relevant information and update it in a matter of seconds, without the process becoming laborious or complex. Check out our best HR Analytics Software article to get an overview of what software is available on the market, and which one best suits your needs.
The importance People Analytics in the HR department
Data analysis on employees is a way of obtaining a huge amount of data about a company’s workforce and its processes. Thanks to this analysis, the HR manager can evaluate the impact of their strategy and ensure their decisions hit the mark.
Moreover, with data close at hand it is possible to improve administrative tasks and processes, thereby optimising time management and budget investments. In turn, you will be able to develop employee potential, by getting to know their needs and having relevant information on the workforce. This could be the level of diversity or salary progression, for example, either individually or by department.
In this sense, there are a number of key indicators for measuring the success and performance of the objectives set by the human resources department. Here we explain which HR Analytics KPIs are the most important for you to take into account.
Hiring sources
Knowing where your company’s hires are coming from is a way to identify which sources are working best to attract talent. Hires can come from job search portals, such as Totaljobs, Indeed, or Monster. They can also come from the company’s own job page or a recruitment agency you have contracted.
On this point, we recommend carrying out a monthly review of the various sources and adapt the recruitment strategy accordingly, based on the ones that deliver the best results.
Average time-to-hire
This metric refers to the time from when a job advert is placed until the new employee joins the business. Knowledge of this piece of data is a key tool to evaluate the efficiency of the hiring process. According to recruitment site Glassdoor, this period is usually 27.5 days in the UK. However, the figure will vary depending on the characteristics of each company and the vacancy in question.
So, we recommend analysing the average time according to the following parameters:
- Job position
- Department
- Offices (if the company has more than one)
- The recruitment agencies used.
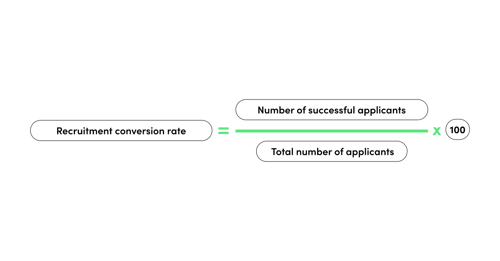
Recruitment conversion rate
The conversion rate allows us to find out which recruitment methods are working best and which hiring sources are most useful in order to optimise the recruitment process. This figure is calculated by dividing the number of candidates selected by the total number of candidates and multiplying by 100.
Doing this type of task manually can be a cumbersome and chaotic process. So, automating the calculation with software is the best way to obtain reliable results and information by department, as well as the source of the hire.
Average tenure at the company
This metric describes the time a worker stays with a company before leaving their job. Finding out the average will give you valuable information on aspects such as employee satisfaction, working conditions or staff remuneration, among others.
Although there are many reasons why a worker may leave their job role, short tenures are usually a negative indicator for the company. It is also one of the first signs that all is not well in terms of workforce satisfaction. On this point, it is useful to calculate the average tenure based on the following aspects:
- Office
- Department
- Age and gender of employee
- Obtain the information broken down by years and months
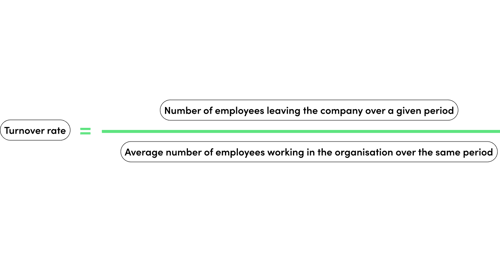
Turnover rate
The turnover rate reveals a company’s ability to retain talent. This is calculated by dividing the number of employees who leave the company in a given period by the average number of employees working at the company in the same period.
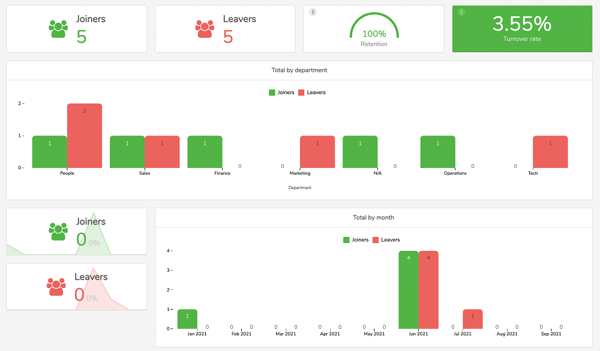
Here, it is also essential to analyse the reason for the termination of employment, and whether or not it is voluntary. It can also be useful to consider the following:
- Retention percentage
- Results by department
- Monthly progression of turnover rate.
Again, automating and digitising this process is the recommended option to obtain conclusive data and gain efficiency and agility.
 *All data shown in images in this article are based on fictitious information.
Work absenteeism
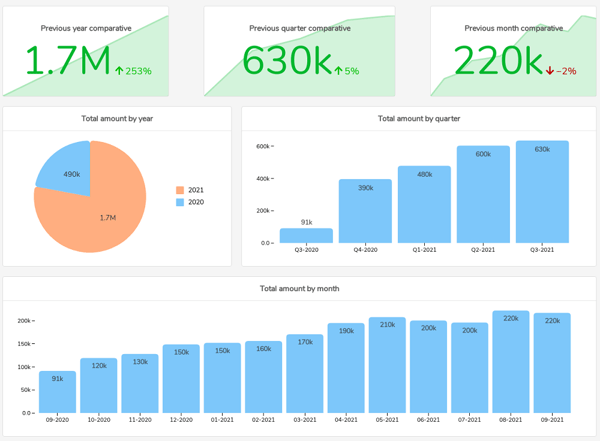
The rate of absenteeism lets us observe whether there are operational failures in the company culture and/or identify problems employees or work teams may be facing. Also, we can use this calculation to quantify the costs arising from absenteeism.
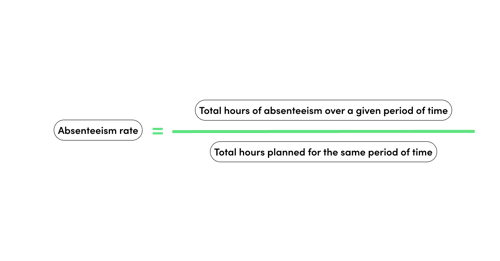
This KPI is measured with the following formula: total hours of absenteeism in a given period divided by the total hours expected for the given period.
When doing this calculation, you will need to take the type of absence into account: whether it is justified or not, and you can do a comparison between:
- Department
- Employees
- Office
- Months
- Expected v completed hours
- Holidays and other absences, as well as sick days
Staff salary progression
To get an overall view of the distribution of pay in your company, you need to find out salary progression. For this, you ideally need to compare salaries by:
- Date range
- Offices
- Departments
- Employees
- Differences between fixed and monthly variable salaries.
This will allow you to find out how much you have invested every year, as well as the company’s average salary.
Duration of onboarding and offboarding
Having adequate, swift, and efficient onboarding and offboarding processes, says a lot about a company and its image. The moments when an employee joins and leaves the company are important for the organisation’s reputation, and for the employee themselves. So, finding out the duration, the number of new starters and leavers in a given period, is fundamental for analysing if it is being done correctly.
For this, it is useful to bear in mind data according to the following parameters:
- Position
- Company
- Office
- Department
- Reason for leaving
Overtime
In the UK, the Working Time Directive states that employees cannot work on average more than 48 hours per week. Therefore, knowing the amount of overtime hours worked per employee will be needed to correct excessive overtime due to a large workload, for example, or other factors.
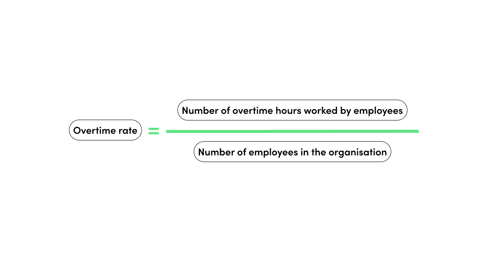
In this case, the KPI is calculated as follows: number of overtime hours worked by employees divided by the number of employees in the company.
You can then analyse the data according to:
- Different departments, offices and employees
- Total monthly overtime hours
- Average monthly overtime hours
Diversity
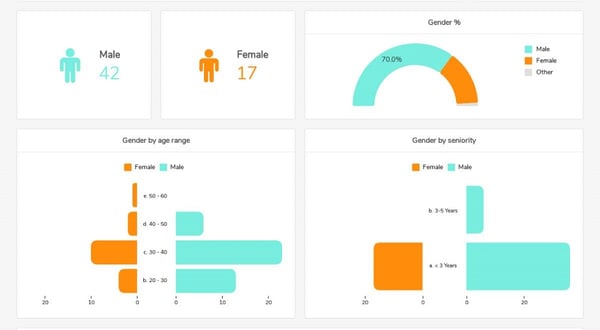
Promoting diversity, in terms of both gender, age as well as nationality in companies is a way to attract talent, boost innovation, get better results and create more equal and tolerant structures.
To analyse the level of diversity in your company, you will need to have the following information:
- Percentage of employees by gender
- Seniority level of employees
- Age of employees
- Percentage of employees according to their nationality and geographical l
- Information broken down by department and contract type
Read more articles on diversity in our blog:
- How to promote Diversity and Inclusion in the workplace
- Diversity & Inclusion for SMEs with Coach Dumi Senda
- Webinar - Inclusive hiring for Tech and Gaming industries
If you want more information about how People Analytics can help you achieve your HR department’s goals, we invite you to arrange a demo with our team of People Analytics experts. They will give you personalised advice on HR Analytics and solutions tailored to your company’s needs.