Establishing salaries and defining employee promotions are among the most difficult, yet most important things an HR department has to do, alongside managers.
Using an Excel template to calculate percentage salary increases for your employees will make this job much more manageable. That's why Kenjo has created this document, so you can compare how to run a compensation plan.
The template will enable you to compare average salaries depending on the country and role. And we've also created a salary matrix which will show you how to calculate salary increases automatically according to each employee's performance.

What information will you see in our Excel template?
This template will enable you to analyse the salary based on a range of factors:
- Gender
- Department
- Age
- Country
- City
- Employee category (C-levels, Heads of, managers…)
- Market comparison
Which metrics can you visualise via default charts in this template?
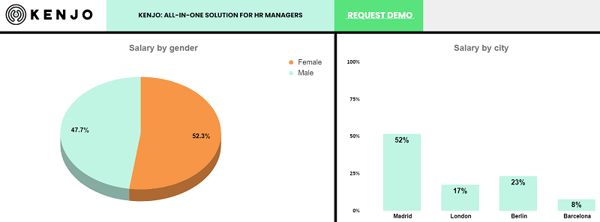
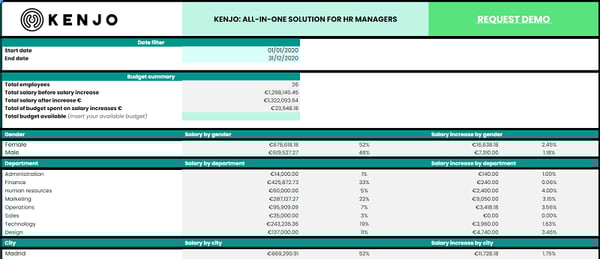
- Salary by gender.
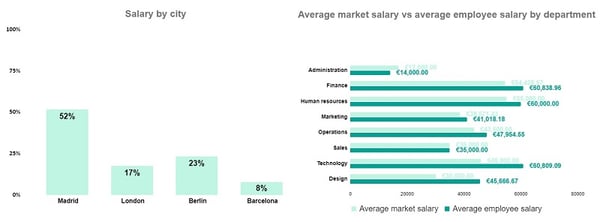
- Salary according to city or office location.
- Salary by department.
- Salary by employee grade.
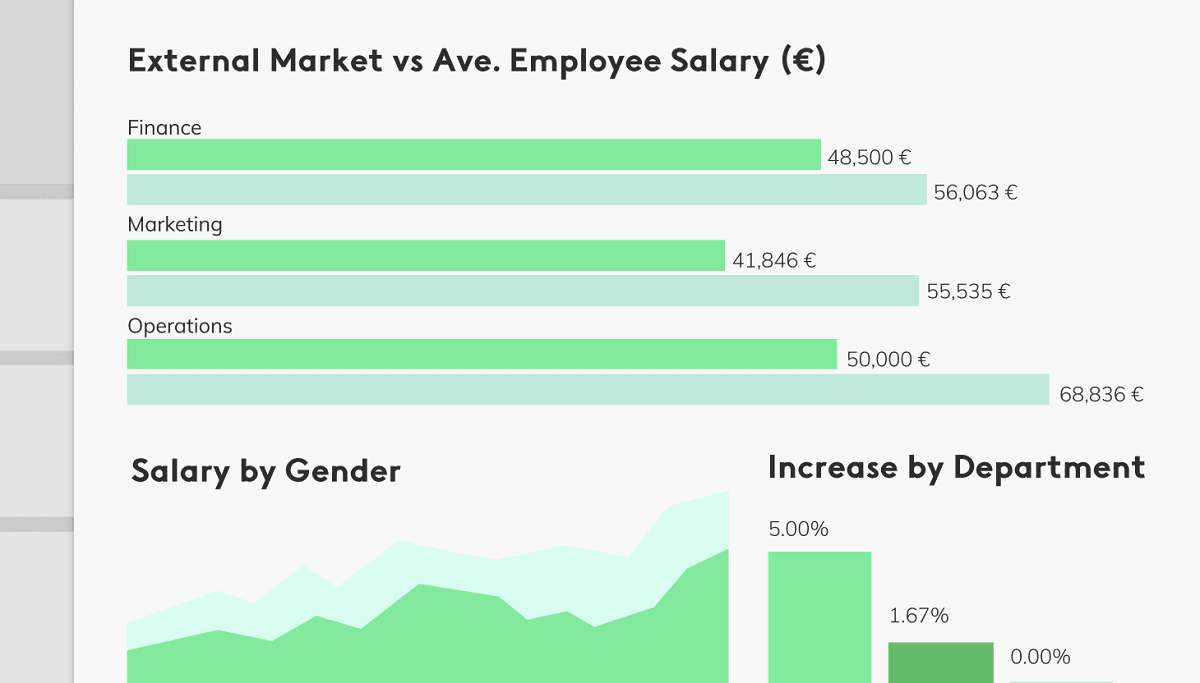
- Average market salary in comparison to your company’s salary, by department.
Why are metrics important in your compensation plan?
Our template will help you organise the data for all your employees' salary increases, calculate the increase based on their performance, and tell you whether you are within or exceeding your budget.
Also, it’s essential to be able to analyse which departments are consuming more financial resources and why. In this way, you can easily visualise and compare which departments have the highest remuneration levels and those that have the lowest.
Employee salary matrix
The ability to examine employee performance over time through performance reviews is vital when working with a compensation plan. And the compensation matrix will help you with this because it has a rating scale. Let’s take a look at how this works.
What is a salary matrix?
An employee salary matrix examines how an employee has performed. It can tell you how much their salary should increase based on this performance and the market average.
For example, Diana Lopez has been a model employee with a high degree of commitment and excellent results. She has led her department effectively, shown decisiveness and achieved her annual objectives. Diana will, therefore, receive a high rating (she'll be given a 3, on a scale of 1 to 3).
But how do we know if Diana’s salary is in line with the market average and what kind of pay rise should she receive in the company?
You can calculate this with the employee salary matrix and see whether Diana’s earnings are below, average or above the average market salary for her role.
By analysing these scenarios with our Excel template you can see the merit salary increase Diana should receive.
Our template shows that Diana is currently earning under 94% of salary compared with the market average. Increasing it by 8% would bring her up to 100% of the market average.
How to use our template to calculate salary increases
Start using our Excel salary increase template by filling in information about your employees. As this is confidential in nature, we do recommend you create a password before you start.
If you still haven't got the Excel template you can download it from the following link: DOWNLOAD EXCEL SALARY INCREASE TEMPLATE.
Follow our step-by-step guide to setting up your human resources Excel template.
STEP 1: Create a copy of the Excel document
Access the document and make a copy by clicking on “File” → “Make a copy.”
STEP 2: Create a password if you are storing confidential information
If you're going to store important and confidential employee information, you can create a private password for the document.
STEP 3: Enter the employee information in the “DATA VALIDATION” tab
1. Click on the “Data Validation“ tab.
2. Fill in the required fields under the heading “Company information.” You can make any necessary edits here.
- Gender: Enter your employees’ gender.
- Grade: You can include a grade for each position. By doing this, you’ll be able to analyse the percentage of payroll for each grade via the “Charts” table. Example:
- Grade A: C-Levels
- Grade B: Head of
- Grade C: Manager
- Grade D: Assistant
- Grade E: Intern/apprentice
- Department: Add and edit the departments in your company.
- Role: Add or edit the roles in your company.
- Country: Add the countries with which employee contracts are associated.
- City: Add or edit the cities associated with your employees’ contracts.
- Performance rating: 1 (poor performance), 2 (average performance) and 3 (high performance).
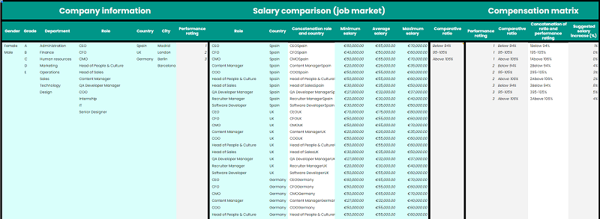
3. In the “Salary Comparison” table, add the average market salary according to the following data:
- Role
- Country
- Minimum market salary
- Average market salary
-
Maximum market salary
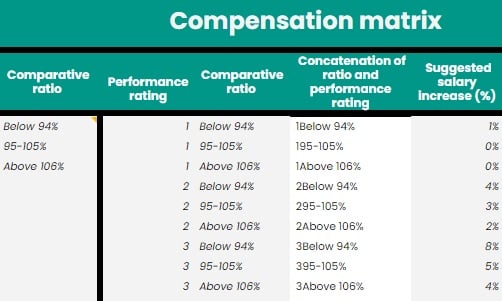
4. Compensation matrix: This compensation matrix enables you to adjust an employee’s salary in the table “Compensation data.”
- If the employee’s salary is below 94%, it will be lower than the market average.
- A salary between 95% and 105% (95%-105%) will be in line with the market average.
- A salary above 106% will be higher than the market average.
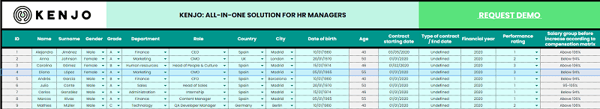
STEP 4: Enter the information related to employees in the “Compensation data” tab
Once you’ve completed all the information in the “Data validation” tab, you can then move on to the “Compensation data” tab to input employee information.
Just replace the fictitious information we have provided with real data from your company.
Once you’ve filled this in, you’ll notice how the corresponding charts and tables are automatically generated in the “Charts” and “Summary” tabs.
If you need to add more lines, copy and paste the last cell that contains data and input new employee information. Remember to copy and paste the formulas from the grey-coloured cells.
STEP 5: Click on the “Summary” tab
This tab gives you a summary of the tables with the most important data, both in volume and percentage.
STEP 6: Click on the “Charts” tab
And lastly, this tab gives you a visual representation of the most important charts for your compensation plan.